As a boomer consumer, what’s your favorite airline? Why do you like it? Is it usually on time? Does it always handle your luggage correctly? Is the staff friendly?
Here is information from “Air Travel Consumer Report February 2009” comparing the performance of different airlines for January to December 2008.
Nineteen airlines are required to report information to the Bureau of Transportation Statistics, a part of U.S. Department of Transportation’s Research and Innovative Technology Administration.
The department’s Office of Aviation Enforcement and Proceedings compiles reports from this information. The comparisons below are from this data:
Flight delays – Percentage of on-time arrivals
Three highest
1. HAWAIIAN AIRLINES – 90%
2. SOUTHWEST AIRLINES – 80.5%
3. US AIRWAYS – 80.1%
Three lowest
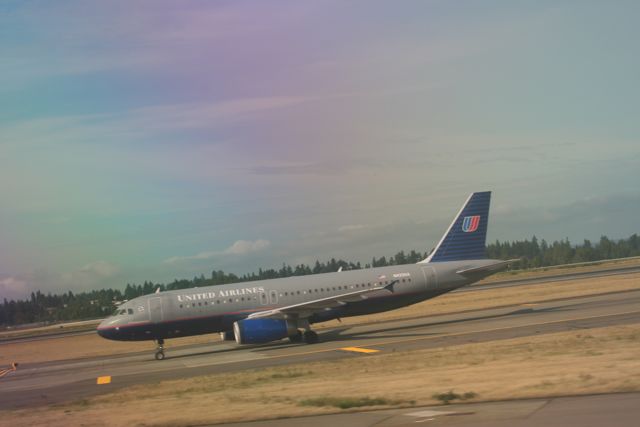
17. UNITED AIRLINES – 71.6%
18. COMAIR – 69.9%
19. AMERICAN AIRLINES – 69.8%
Mishandled baggage – Reports per 1,000
Lowest rates of mishandled baggage
1. AIRTRAN AIRWAYS – 2.87
2. HAWAIIAN AIRLINES – 2.97
3. JETBLUE AIRWAYS – 3.47
Highest rates of mishandled baggage
17. COMAIR – 8.32
18. ATLANTIC SOUTHEAST AIRLINES – 9.82
19. AMERICAN EAGLE AIRLINES – 9.89
Oversales – Involuntary denied boardings per 10,000 passengers
Fewest denied boardings
1. JETBLUE AIRWAYS – 0.01
2. HAWAIIAN AIRLINES – 0.07
3. AIRTRAN AIRWAYS – 0.34
Most denied boardings
16. AMERICAN EAGLE AIRLINES – 2.44
17. COMAIR – 3.41
18. ATLANTIC SOUTHEAST AIRLINES – 3.89
Consumer Complaints – Complaints per 100,000 enplanements
Fewest complaints
1. SOUTHWEST AIRLINES – 0.25
2. EXPRESSJET AIRLINES – 0.42
3. ALASKA AIRLINES – 0.45
Most complaints
17. DELTA AIR LINES – 1.80
18. UNITED AIRLINES – 1.85
19. US AIRWAYS – 2.01
How did your favorite airline rank in these listings? If you didn’t see it, check the report for details.
In October, the bureau began gathering data on tarmac delays. I didn’t include information on this because statistics for 2008 aren’t available.
For information on tarmac delays for February 2009, see this news release from the bureau.
FlyersRights.org, an air passengers' rights group, doesn’t think the bureau statistics on tarmac delays are accurate.
In a report, the “2008 Real Air Travel Consumer Report Card,” the group said there were more than 1,200 tarmac strandings – in which passengers are locked in planes on the runways – in 2008.
The report card is based on government statistics, press reports, airline website data, FlyersRights hotline reports, and eye witness accounts provided by the group’s coalition members for the period from January 2008 through December 2008. (Click on 2008 Report Card on the left side of the Web page under “Events” to find the pdf report.)
In the FlyersRights’s report, Delta, JetBlue, American, US Airways, and Comair received the grade of "F" for tarmac delays of four-plus hours.
United Airlines and Atlantic Southeast got a "C." Alaska, Northwest, Frontier, Hawaiian, and Southwest received an "A."
My next posts will be on “Which Airlines Are the Safest?” and “Safe and Dangerous Airports.”


